Beers, stats and kids
I
My partner's family owns a tavern in a mountain village, a family-run business that has been operating for nearly three decades. When she was younger, she helped with serving, cooking, and cleaning.
Now, we often visit with our kids, who love helping the staff by serving drinks, while we pitch in with serving and cleaning as well.
Of course, if we stay there for too long, the kids eventually get bored. And that's a good thing. It sparks their creativity, and they end up coming up with fun new games to play. If you have kids, try letting them get bored - it’s amazing how their creativity kicks in.
They started collecting beer bottle caps and soon began using them to build all sorts of creative structures. Building structures with beer bottle caps.
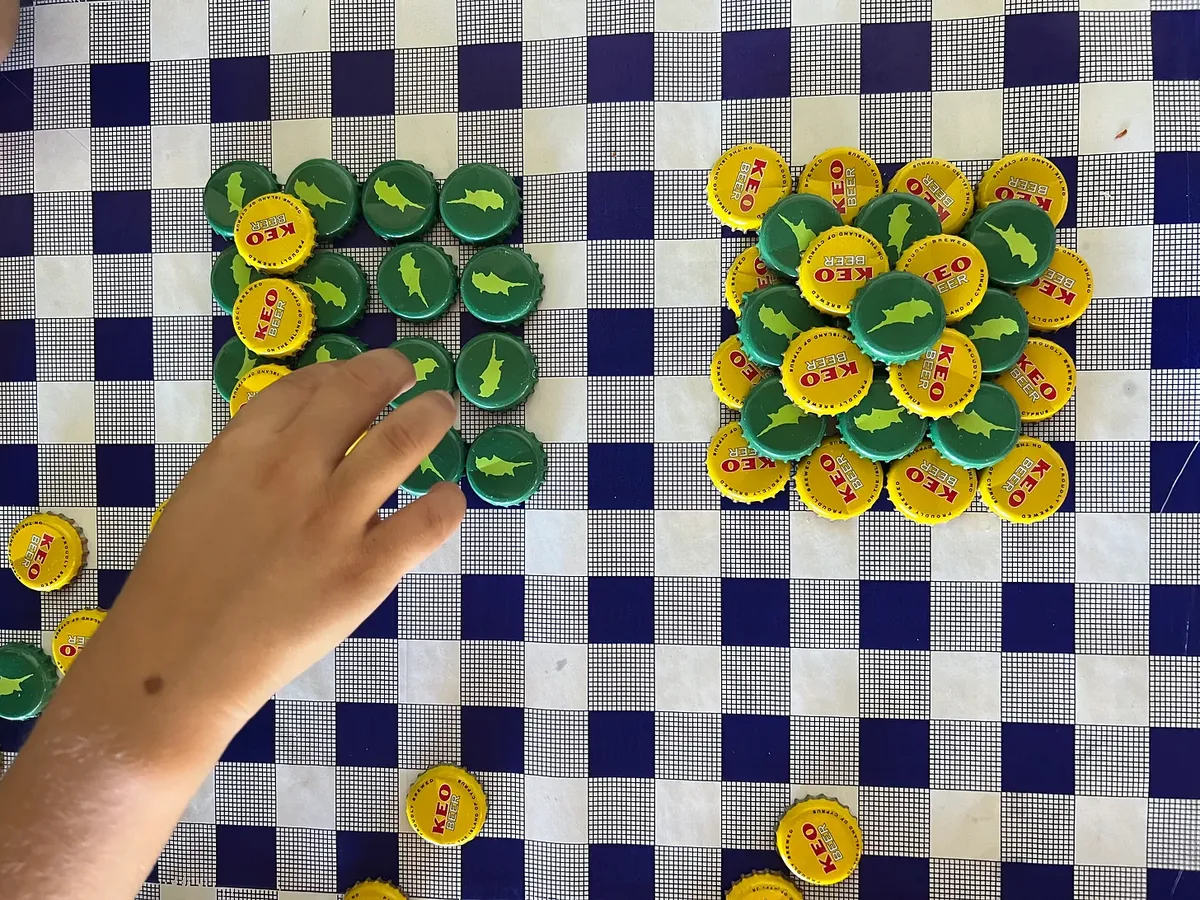
After a while, our conversation turned to beer and the preferences of Cypriots. I asked them, "Which beer do you think is more popular among Cypriots - KEO or Carlsberg?"
We then began treating the beer bottle caps as data points. The first step was to collect all the caps from the beers opened that day, aiming for a complete and accurate dataset without significant gaps or errors. While we likely missed a few caps, we assumed that the number was small enough not to significantly affect the overall distribution.
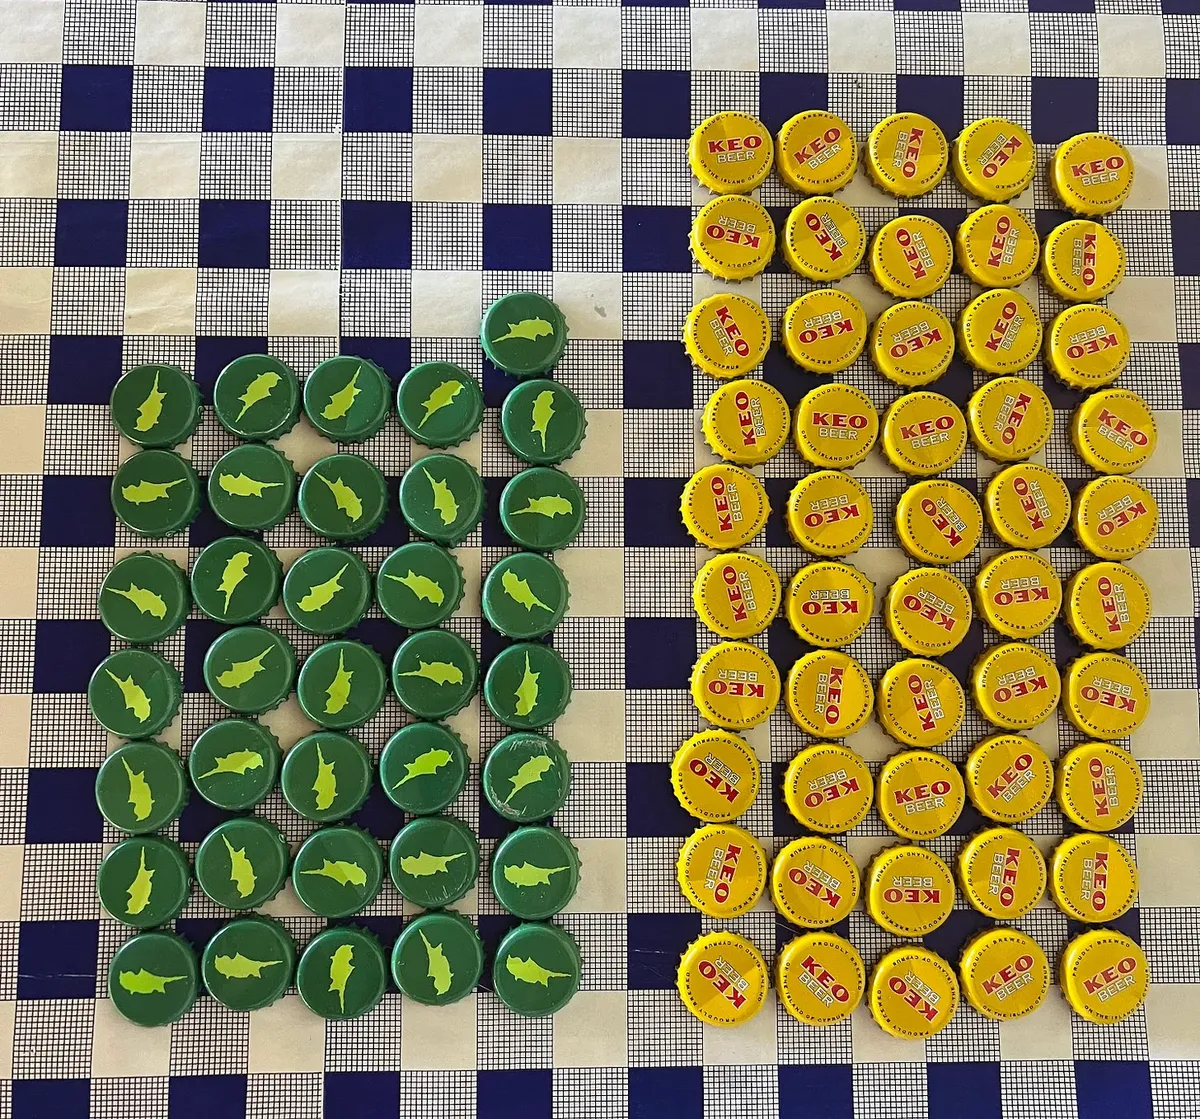
Next, they started counting the caps and found 50 from KEO and 36 from Carlsberg. After tallying the results, we brainstormed different ways to visualize the data. How to visualize them? Find an appropriate structure to create! They came up with this: Assembling a bar graph using the beer bottle caps.
II
Clearly, KEO caps are much more than then Carlsberg caps. Then, we tried to think of percentages. To explain this, we started with the idea of "100": a percentage is a way to describe parts of a whole, where the whole is always 100. So if you have a pizza with 4 pieces, if one get 2 and the other one 2, then each one gets half a pizza. If we cut the pizza in 100 tiny pizzas, then if one gets 50 and the other one gets 50, then each one gets half of a pizza again. In percentages, a half is 50%.
But, we didn’t have 100 caps, we had only 86 :) They had to play a bit with their imagination. We had to imagine what the numbers would be if we had 100. If we would continue finding and collecting caps, until we reached 100, about 58 of these 100 would be KEO caps. This is 58%. And the Carlsberg caps would be 42%.
After a point, both kids said, "OK! Cypriots prefer to drink KEO over Carlsberg, since from our caps sample, 58% were KEO and 42% were Carlsberg."
III
But wait a minute! Is that really correct? Can we draw such a conclusion based on our sample?
This is where we started a discussion on the idea of sampling. While our caps give us a snapshot, they only represent a small group of people who drank beer on that particular day at the tavern. This means our results might not perfectly reflect the beer preferences of all Cypriots.
That didn’t go as planned, so we went back to our favorite game - building with LEGO bricks! The conversation that followed was really interesting and went something like this:
Me: Imagine you have a big box filled with LEGO bricks in all sorts of colors. If you close your eyes and randomly grab a handful, you might get mostly red bricks and think: "Wow, there are a lot of red bricks in the box!"

Kid: Yes!

Me: But, since your hand is small…

Kid: My hand is not small!

Me: Ok, of course! But even my hand, can not grab all the LEGOs in the box. So you have in your hand is a sample. And what is in the box, we say that it is the entire “population” of LEGO bricks. Like at the restaurant. The people at the restaurant was the sample and the entire Cypriots in Cyprus is the population.

Kid: But there are Cypriots in other countries as well.

Me: That is true, but let’s for this game think only about Cypriots in Cyprus - now, that handful might not show all the colors in the box. So, to mix things up, you shake the box really well, which helps the different colors spread out more evenly. Now, when we shake the box, we’re trying to mix the bricks up so they’re spread out more evenly. This way, when you grab a handful, you have a better chance of picking different colors. Each handful is random, which can be a good thing because randomness helps us avoid bias - like always grabbing the same color bricks if they weren’t mixed up.

Kid: Why do that?

Me: Remember the last time you played with LEGO bricks? You wanted to build a red robot, and by the time you finished and put the bricks back, all the red LEGO bricks ended up back in the same spot in the box.

Kid: Oh, I see! So randomness is a good thing!

Me: Yes, but randomness can also be tricky. Even after shaking, a single small handful might not represent all the colors in the box. For example, you could still randomly grab mostly red bricks by chance. This is why, it is better to take multiple random samples. By taking more than one handful and looking at all of them together, we get a better idea of the overall distribution of colors (or beer preferences, in our original example).

Kid: But I can pick so many handfuls of bricks that at the end I can take all of them!

Me: Yes, you can do that with the LEGO bricks, but in real life, it is very difficult to go for example ask all the Cypriots what beer they drink.

Kid: Then I can use both hands to get a bigger sample!

Me: Yes, that is true, if you can get a bigger sample, it is better, it can be more reliable. But maybe it is not possible. Like the case now, with the people at the tavern that are only 300.

Kid: You are right, people are all over the place!
IV
After our discussion on what is sampling, we concluded that the people at the tavern was not a good sample of the entire population and that our sample is quite small and biased. There were only 300 people there and the entire population of Cyprus is around 1.3 million. Our sample was also likely biased towards the preferences of people who visit that particular tavern. So we can not be certain whether the percentages we had based on the beer bottle caps represent all the population in Cyprus. But we thought of it as a trend that we need to examine further in our next